Viewing the solution on the map
You can open the solution on the mvrp-map and share it. The solution can be viewed without logging in to the service.
The mvrp-map is available at https://yandex.com/courier/mvrp-map. To open the solution on the map, choose one of the following methods:
-
Plan a solution or open a ready one in the Planning section.
-
In the upper-right corner, click Export → JSON → Map.
Open the link
https://yandex.com/courier/mvrp-map#<task_id>
where task_is is the solution ID. For more information, see Working with the resulting solution.
How to get task results in JSON format
- When working with the resulting solution in Planning, click Export → JSON.
- Using the API (for more information, see Obtaining results).
-
Open the link
https://yandex.com/courier/mvrp-map#json -
Click Upload JSON in the upper-right corner and select the file.
Note
Only solved tasks open on the map.
To contact support, click Support in the upper-right corner.
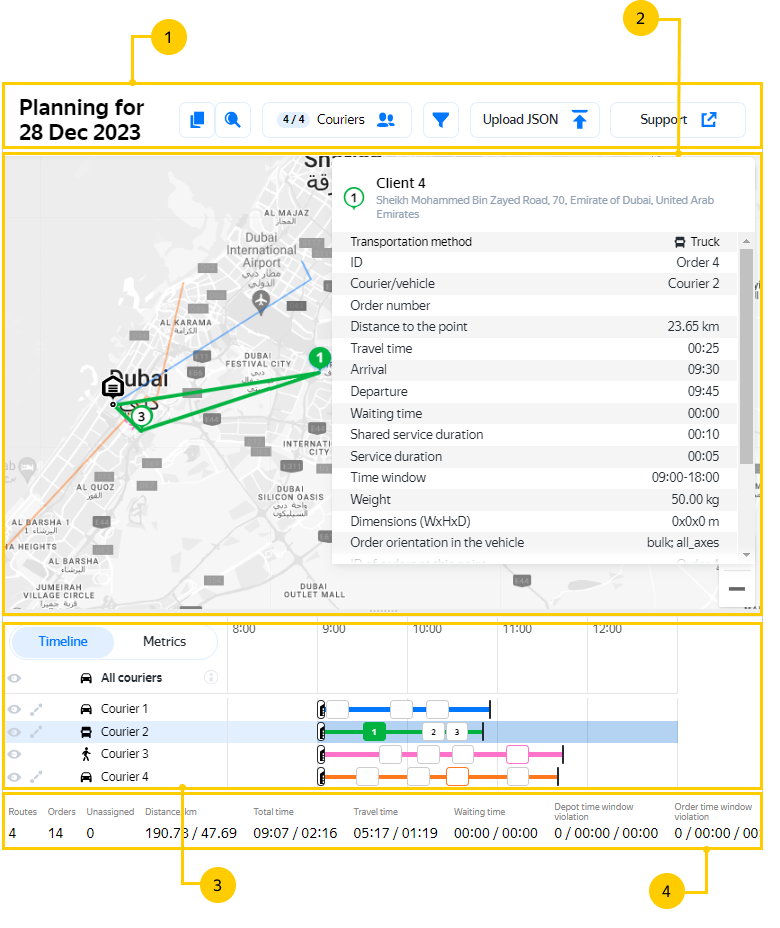
Page elements
The solution page contains:
- Control panel: Solution actions and control buttons.
- Map: A geographical representation of the routes and unassigned orders.
- Routes: Timeline and solution metrics.
- Solution statistics: Final indicators.
All violations are highlighted in red.
Control panel
Date
The date that the solution is planned for.
Copy the planning link
Use the icon to copy the link to a ready solution.
Search
Use the search to go to an object: select an order or a route from the drop-down list, and it will be highlighted in the blocks.
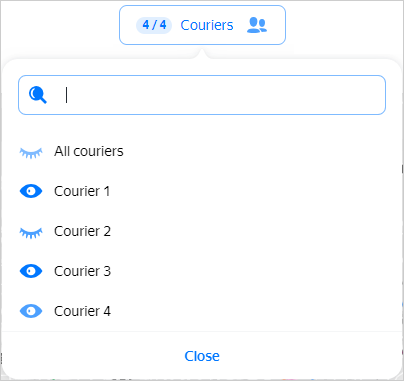
Couriers
You can hide routes from specific employees.
Filter
Appears if the Vehicle tags option was used during planning.
The filter lists the values from the Vehicle properties field in the Routes table (equivalent to tags). To display routes that match specific vehicle properties, select the relevant value. You can select multiple values. As a result, data is filtered across all blocks.
Upload JSON
You can upload a ready solution in JSON format to have it displayed on the map.
Support
A button for contacting support.
Map
The map shows the geographical location of routes and unassigned orders.
Hovering over a stop or depot brings up a waypoint card with information.
Note
If the route contains multi-orders, zoom in on the map to see all the orders being delivered together.
To display the trailer reloading, coupling, and decoupling locations on the map, contact support to have the option activated.
Routes
There are two display modes: Timeline (default) and Metrics.
To view the result with the parameters from the API response, click  . The Planning metrics pop-up window contains the values of the main solution metrics and options.
The icon switches the route display mode: simple straight lines or laid over roads. The "laid over roads" mode is available for car and truck routes.
Timeline
In this mode, routes are presented as a Gantt chart. The size of the stop and depot elements is proportional to the planned time the courier spends at the corresponding location.
Hovering over a stop or depot brings up a waypoint card with information.
Metrics
The metrics table shows the values of key parameters of the routes you've built.
Hovering over the courier ID in the first column of the table shows the total route cost. To sort the data in the metrics table by column, click the column header (once or twice depending on the preferred sorting order).
Solution statistics
At the bottom of the page, you can see the total and average indicators for the solution. Hovering over an indicator shows a tooltip with its description.