Viewing the solution on the map
You can open the solution on mvrp-map and share it. The solution can be viewed without logging in to the service.
mvrp-map is available at https://yandex.com/courier/mvrp-map. To open the solution on the map, choose one of the following methods:
Follow https://yandex.com/courier/mvrp-map#<task_id>, where task_id is the solution's ID. For more information, see Working with the resulting solution.
- When working with the resulting solution in Planning, click .
- Using the API (for more information, see Obtaining results).
Go to https://yandex.com/courier/mvrp-map, click Upload JSON in the upper-right corner, and select the file.
Only solved tasks open on the map.
To contact support, click Contact support in the upper-right corner.
Page elements
The solution page contains:
- Control panel: Solution actions and control buttons.
Map: A geographical representation of the routes and undistributed orders.
Routes: Timeline and solution metrics.
- Solution statistics: Final indicators.
All violations are highlighted in red.
Control panel
To see the location of an object on the map, use the Address or object field. A drop-down list with suggestions appears when you start typing the address or the name of the object. Selecting an object from the list pins it on the map.
To display specific routes on the map, select them in the corresponding block in the upper-left corner.
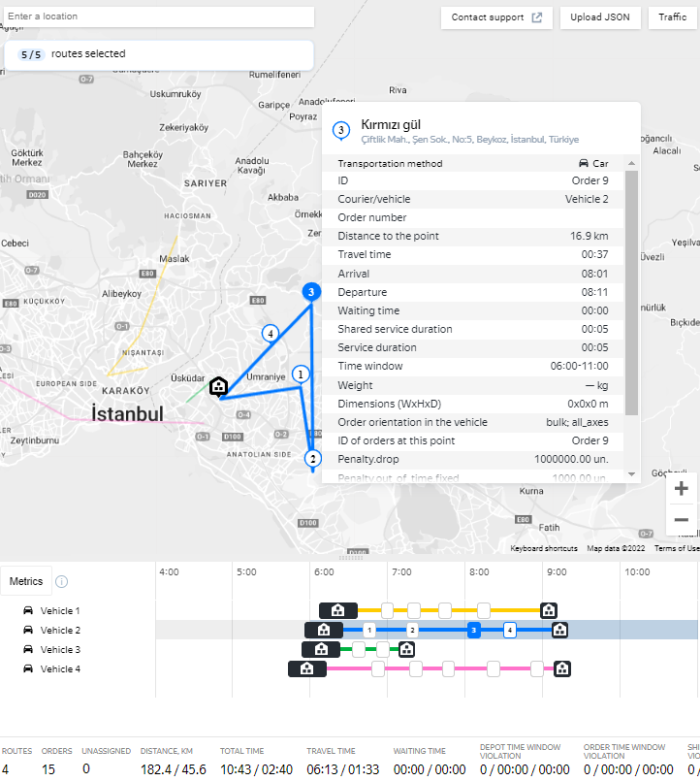
Map
The map shows the geographical location of routes and undistributed orders.
Hovering over a stop or depot brings up a waypoint card with information.
If the route contains multi-orders, zoom in on the map to see all the orders being delivered together.
Routes
There are two display modes: Timeline (default) and Metrics.
To view the result with the parameters from the API response, click  . The Task information pop-up window contains the values of the key solution metrics and options.
Timeline
In this mode, routes are presented as a Gantt chart. The size of the stop and depot elements is proportional to the planned time the courier spends at the corresponding location.
Hovering over a stop or depot brings up a waypoint card with information.
Metrics
The metrics table shows the values of key route parameters.
Hovering over the courier ID in the first column of the table shows the total route cost. To sort the data in the metrics table by column, click the column header (once or twice depending on the preferred sorting order).