Plan / Fact graphs
Plan / Fact graphs are used to analyze completed routes. You can use them to visually represent summary route or order information and compare periods. For example, you can easily see how many orders were planned, completed, and completed with violations.
Create a graph
To create a graph, set filters at the top of the page:
Select a cross-section:
- Number of routes
- Number of orders
- In the depot list, deselect the depots that you don't need to compare. If you have a large number of depots, use the search function.
Select the sorting method:
- Alphabetically
- By volume: fact
- By volume: plan
- By volume: declined
- Select ascending or descending order.
Set the period to create graphs for.
You can select a period from the list (Yesterday, 7 days, 30 days, Last month) or set your own. The maximum length is 60 days.
Note.The current day can't be included in the graph, even if the routes that you're interested in have already been completed.
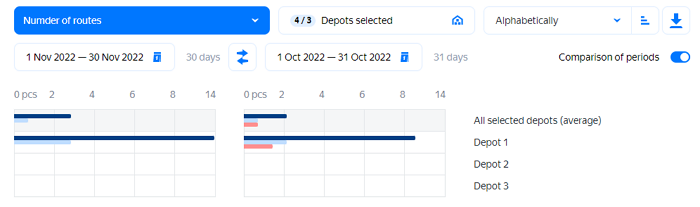
Compare periods
By comparing periods, you can find how many more or fewer deviations from the planned routes there are now:
- Enable Comparison of periods.
Select the periods to compare. You can change them without making a new request.
For the comparison to be objective, the periods must be the same length.
Read the graph
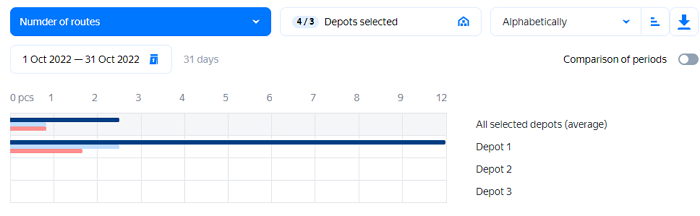
The graph shows information for all the selected depots, even if factual or planned data is missing for some of them. The average value is also calculated based on data for all depots.
When you hover over the graph, a pop-up window and button to generate a report appear.
The information in the pop-up window depends on the mode:
The window displays summary information for the selected depot.
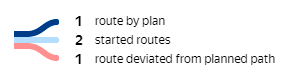
If you selected the Number of routes cross-section:
- The planned number of routes.
- The number of started routes.
- The number of routes that deviated from the planned path.
If you selected the Number of orders cross-section:
- The planned number of orders.
- The number of delivered orders.
- The number of orders with time window violations.
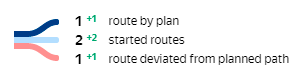
In comparison mode, you can see the differences between periods as well as the information from standard mode
Generate a report
When you hover over the depot graph, the  button appears. Press it to generate an Excel report for a specific depot for the selected period.
A notification appears when the report is ready with the report name (the name is generated automatically and contains the start and end dates of the period).
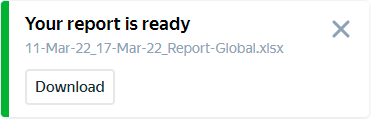
Click Download to view the report. If you close the notification, you can return to the list of available reports later. You can do this by clicking the  icon in the upper-right corner.